← All services
Data & analytics
Make your data useful
Useful reporting starts before the dashboard.
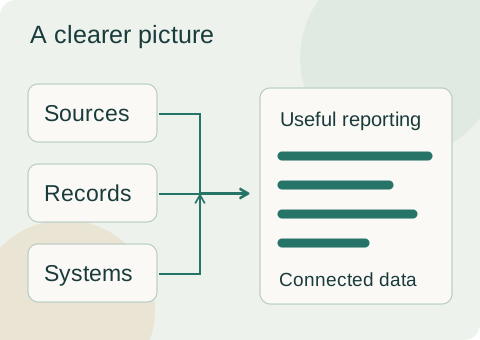
- Bring information together.Pipelines, transformations, and models that connect your sources.
- Make it understandable.Reporting that answers questions for the people who need it.
A starting point
Does this
sound familiar?
- Your reports depend on pulling information from different systems by hand.
- Your team needs dependable pipelines for analytics.
- You need dashboards that answer specific business questions.
Our approach
The work
in practice
- ETL and data pipelines
- Data modeling and transformations
- Business intelligence, operational dashboards, and reporting
- Data quality, governance, and observability
- Connections between business data sources
A scoped data pipeline or reporting improvement, with source systems, refresh needs, definitions, and ownership made explicit.
Book a call (opens in a new tab)Related experience & thinking
Experience behind the work
We deliver healthcare data work, including ETL, analytics, and dashboards. See how this fits alongside our wider team experience.
How we work
From conversation to delivery
Tell us what’s happening
Your goal, what’s difficult, and what you’ve already tried. We’ll talk through where you need help.
Understand it together
Where discovery would help, we agree its scope and terms with you before starting.
Agree a clear plan
What we’ll deliver, who does what, timing, and cost—all agreed before delivery begins.
Build, review, improve
Review useful progress together. Testing, handover, and ongoing support are agreed as part of your project.